Algorithm Analysis
Specificity, Sensitivity and likelihood ratio
The likelihood ratio is a combined value from both the specificity and sensitivity of a given test. The specificity of a test is related to the test’s ability to identify negative results and will decrease as the number of false positive increases. Thus a positive result from a test with high specificity has a high probability of being an actual positive. Conversely, the sensitivity of a test relates to the test’s ability to identify positive results and will decrease as the number of false negative increases. Thus a negative result from a test with high sensitivity has a high probability of being an actual negative.
Our TCD examination should ideally have high specificity and sensitivity values. High specificity values allow the monitoring process to identify when the clot-dissolution therapy is working and high sensitivity values allow it to identify when the therapy isn’t working.
The likelihood ratio is a good standard for determining the utility of diagnostic tests and is commonly used in the medical world. The ratio is a comparison of how much more likely patients who test positive are true positives to patients who test negative who are false positives.
We chose a threshold of LR+≥5 since tests with values over 5 are considered to increase post-test odds of being a true positive significantly.
Return to Normal Flow
“Recovery did not occur if MV was less than 20 cm/sec or less than 50% of the unaffected side. With MV [mean velocity] between 20 and 40 cm/sec (50%-80% of unaffected side) the probability of recovery was about 25%, and above 40 cm/sec (about 80% of unaffected side), the probability of recovery was about 75%. Predictability based on absolute velocity was not much different the first 12 hr than on the second day. However, there were no recoveries if the velocity was less than 80% of the unaffected side after 12 hr.”
This study with N=51, shows the importance of normal mean flow velocities. When normal flow does not return, the patient is at greater risk for developing upstream occlusions and does not recover.
If the patient does not return to normal flow, then more invasive procedures can be used such as intra-arterial therapy used in a bridging protocol. Thus, identifying return to normal flow is the most important aspect our detection algorithm should focus on.
Parameters
One very helpful resource we found to help us create parameters for the algorithm has been “TCD Criteria for Recanalization.”
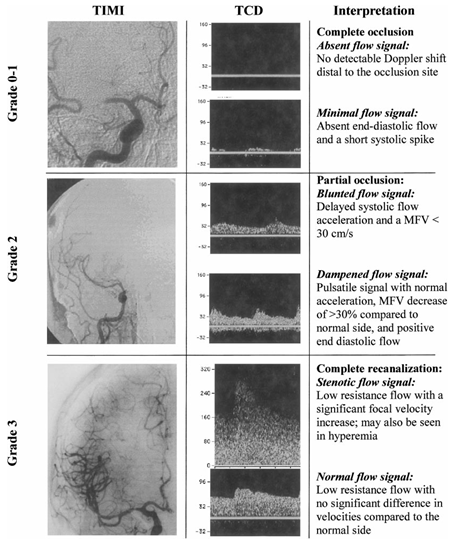
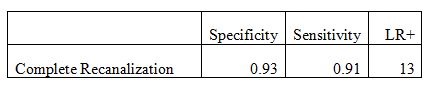
The study identifies three conditions after thrombolytic treatment: complete occlusion; partial occlusion and complete recanalization based on waveform shape, PI and MV. Complete recanalization will display either a stenotic or normal flow signal. We can consider the stenotic flow signal as normal because the flow volume will be equivalent to normal flow. Below are the calculated sensitivity and specificity for the respective N=25 experiment.
We can take the parameters used to characterize complete recanalization for our normal flow specification. This gives a satisfactory likelihood ratio. We therefore set our threshold value of detecting normal flow to have an MCA MV ≥ 70% of the contralateral MCA MV. This threshold value can also be used to notify the user when normal flows are not detected (when MCA MV stays at < 70% of contralateral MCA MV). However, in determining when clot-dissolution begins, more parameters are needed because initiation of recanalization is a dynamic process and not an endpoint (like normal flow).
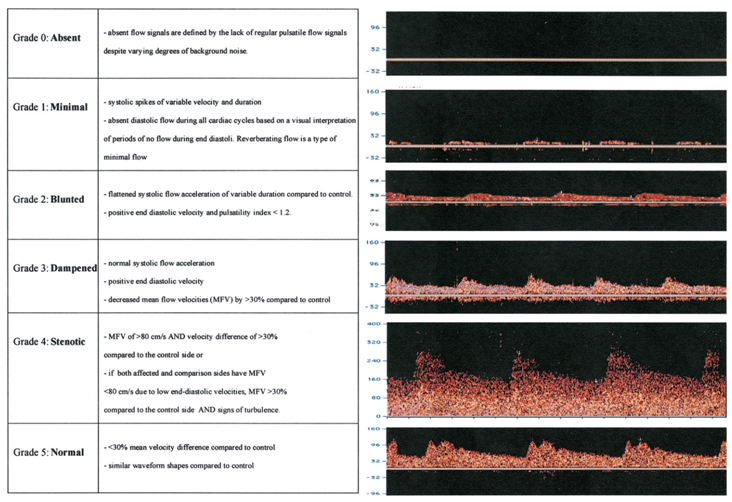
Alexandrov et al define the beginning of recanalization based on when one of the following flow signal changes is detected: 1) waveform change by ≥ 1 TIBI residual flow grade; 2) appearance of embolic signals; 3) flow velocity improvement by ≥ 30% at a constant angle of insonation; 4) signal intensity and velocity improvement of variable duration at constant gain/sample volume/scale settings; and 5) appearance of flow signals with variable (>30%) pulsatility indexes and amplitude of systolic peaks. Since there is no definitive method for validating this definition, specificity and sensitivity definitions are not available.
Alexandrov et al define the beginning of recanalization based on when one of the following flow signal changes is detected: 1) waveform change by ≥ 1 TIBI residual flow grade; 2) appearance of embolic signals; 3) flow velocity improvement by ≥ 30% at a constant angle of insonation; 4) signal intensity and velocity improvement of variable duration at constant gain/sample volume/scale settings; and 5) appearance of flow signals with variable (>30%) pulsatility indexes and amplitude of systolic peaks. Since there is no definitive method for validating this definition, specificity and sensitivity definitions are not available.
The case for mean velocity or % mean velocity
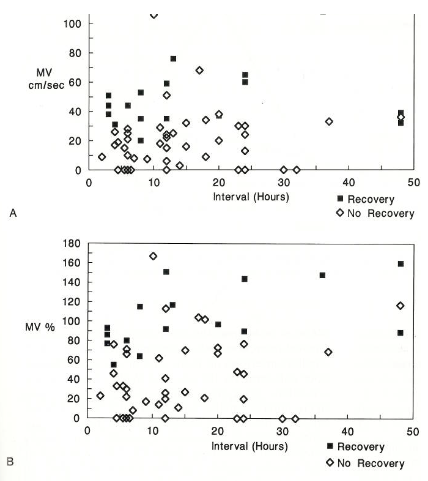
Hansley and Tan look at affected MCA mean flow velocity compared to contralateral MCA velocity. In their analysis, they found that MV% was a significant measurement (p=0.028) but MV difference was marginal (p=0.068). See below for a graphical comparison of the two.
Hansley and Tan look at affected MCA mean flow velocity compared to contralateral MCA velocity. In their analysis, they found that MV% was a significant measurement (p=0.028) but MV difference was marginal (p=0.068). See below for a graphical comparison of the two.
It also become important how we define mean velocity (over what sample volume). If a large sample volume is necessary, the MCA waveform may be contaminated by neighboring flow dynamics, especially the carotid siphon at 55mm.
Indices of Pulsatility (PI)
PI is an easy measurement that TCD is capable of making. Gosling defines pulsatility as follows.
Indices of Pulsatility (PI)
PI is an easy measurement that TCD is capable of making. Gosling defines pulsatility as follows.

PI is a useful complementary measurement. However, due to “individual variation in vascular dynamics and the influence of other hemodynamic factors including heart rate, stroke volume, blood viscosity an vascular compliance on the oscillatory behavior of the blood flow, it seems difficult to estimate vascular resistance from pulsatility analysis alone.”
ACA and PCA
ACA and PCA are “detected less reliably because of the frequent variability of vessel caliber, course, angle of insonation, and anatomic configuration deviations in the circle of Willis.” However, like PI, these measurements can be important pieces of information to the TCD operator. In Burgin et al’s work, the ACA and PCA were used to measure collateral flow, a large sign of occlusion.
Embolic Signals
Since our client’s therapy will utilize submicron magnetite particles, the principles of cerebral emboli should still apply to these. We originally wanted to use the embolic signals to notify the user of clot-dissolution because presumably the signals wouldn’t pass until the vessel patency is at least nonzero. However, the concentration of the magnetite particles is variable patient to patient and it is unknown how the particles will look in the TCD readout. Additionally, embolic signals can also be a sign of recanalization originating from the dissolved clot, and differentiating the two sources of emboli presents a field of future investigation.
Embolic signals from the magnetite particles can potentially produce a significantly different TCD readout for patients undergoing Pulse’s therapy compared to a normal tPA therapy. However, the effect is not currently known. Microemboli with diameters on the scale of 100 microns are commonly captured by TCD, but since Pulse’s therapy uses submicron particles, TCD may or may not detect the magnetite particles.
Analytically, we know that the embolus to blood ratio, which is a ratio of the acoustic power backscattered from the embolus compared to that of blood, is defined by:
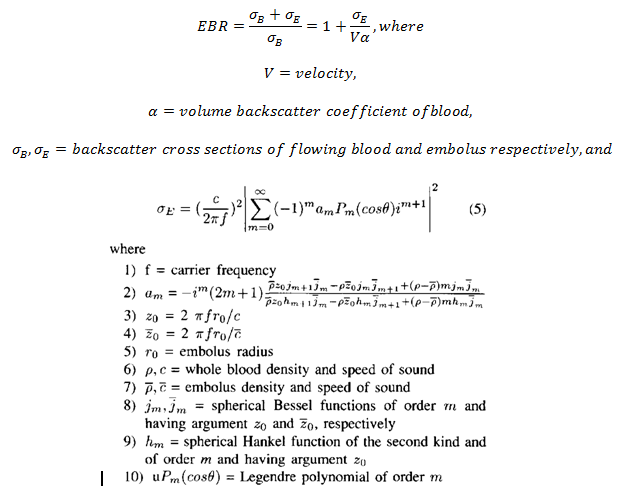
As we can see, as the embolus radius gets smaller, the backscatter cross section of the embolus goes to zero, causing the embolus to blood ratio to go to one.
In the presence of a magnetic gradient, the magnetite particles form structures on the order of 3-5 microns. Preliminary testing evidences that these structures will be visible when they are in the TCD sample volume.
The magnetic gradient poses another confounding factor since it will cause the particles to flow differently from blood. The gradient oscillates at 3 Hz and could possibly distort normal TCD readings of the MCA. We recognize the need for a filter to obtain a clean signal of intracranial blood flow during therapy and suggest that one be constructed once experimental data is available.
Parameter Notes
The parameters for detecting normal velocities meet specifications; however, detecting clot-dissolution initiation does not. Due to this, we must widely incorporate user input. Using Alexandrov’s criteria for recanalization initiation, we see that our algorithm does help in this process, but it is far from automated.
Waveform analysis according to Alexandrov et al is more predictive of vessel patency than velocity measurements. However, the lack of experimental data precludes our ability to quantifiably compare waveform shape changes.
